
Why monitor competitors' historical changes?
There are two compelling reasons to track how your competitors' digital offerings change over time:
- It's an effective way of identifying new digital techniques, trends, and market shifts
- It can save months of unproductive discussions and trial and error
Are the changes a step backward, or an improvement? A single competitor's initiative, or a new market trend?
More to the point, how have the changes worked out for your competitors?
Understanding the impact they've had on how customers experience the product, and, in turn, on their market position can be immensely valuable in shaping your own way forward. It can help you decide which features to prioritize, and even the best way to implement them.
How historical functionality change works
Historical functionality change gives you an overall view of how many features a competitor has added (and how many they've removed) in a given time-period. This includes the categories those features belong to, and a complete list of which functionalities these are.
So what does this look like in practice?
Historical functionality change in action: an example
Let's say you want to know the current state of the US market.
You've selected a group of banks that make up your top competitors, your "market of focus." You decide you want to look back one year to December 2022.
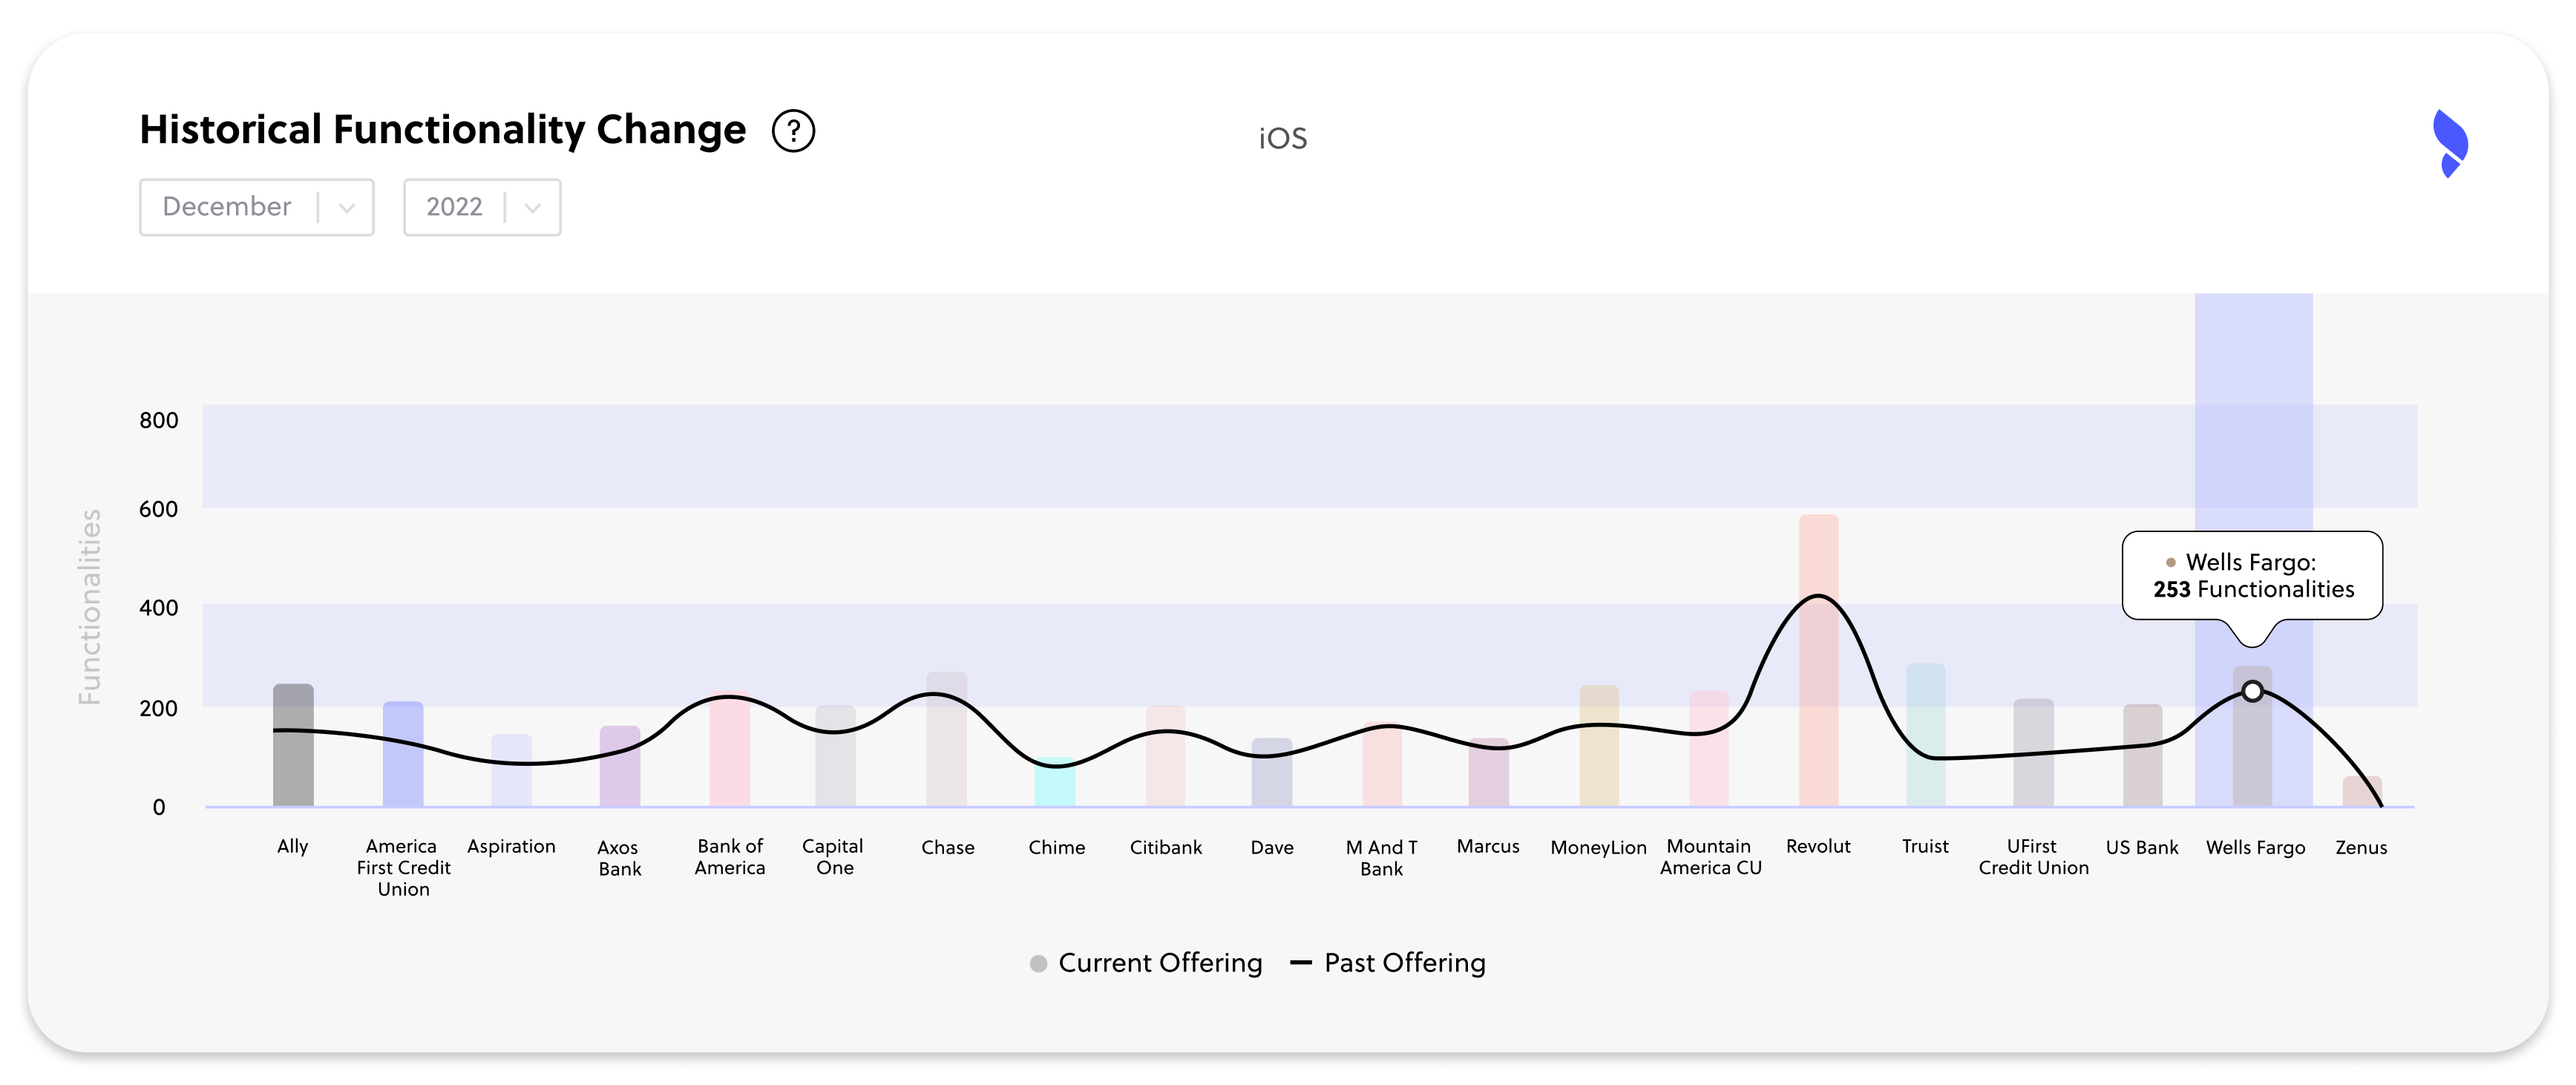
FinTech Insights' historical functionality change graph will show you how many functionalities each of the banks in your market of focus had in December 2022, and how many they had on 1 January 2024.
The graph below, for instance, shows noticeable increases in Revolut's, Truist's, and Wells Fargo's functionalities.
Once you've seen a market overview, you can explore what individual competitors have changed in more detail.
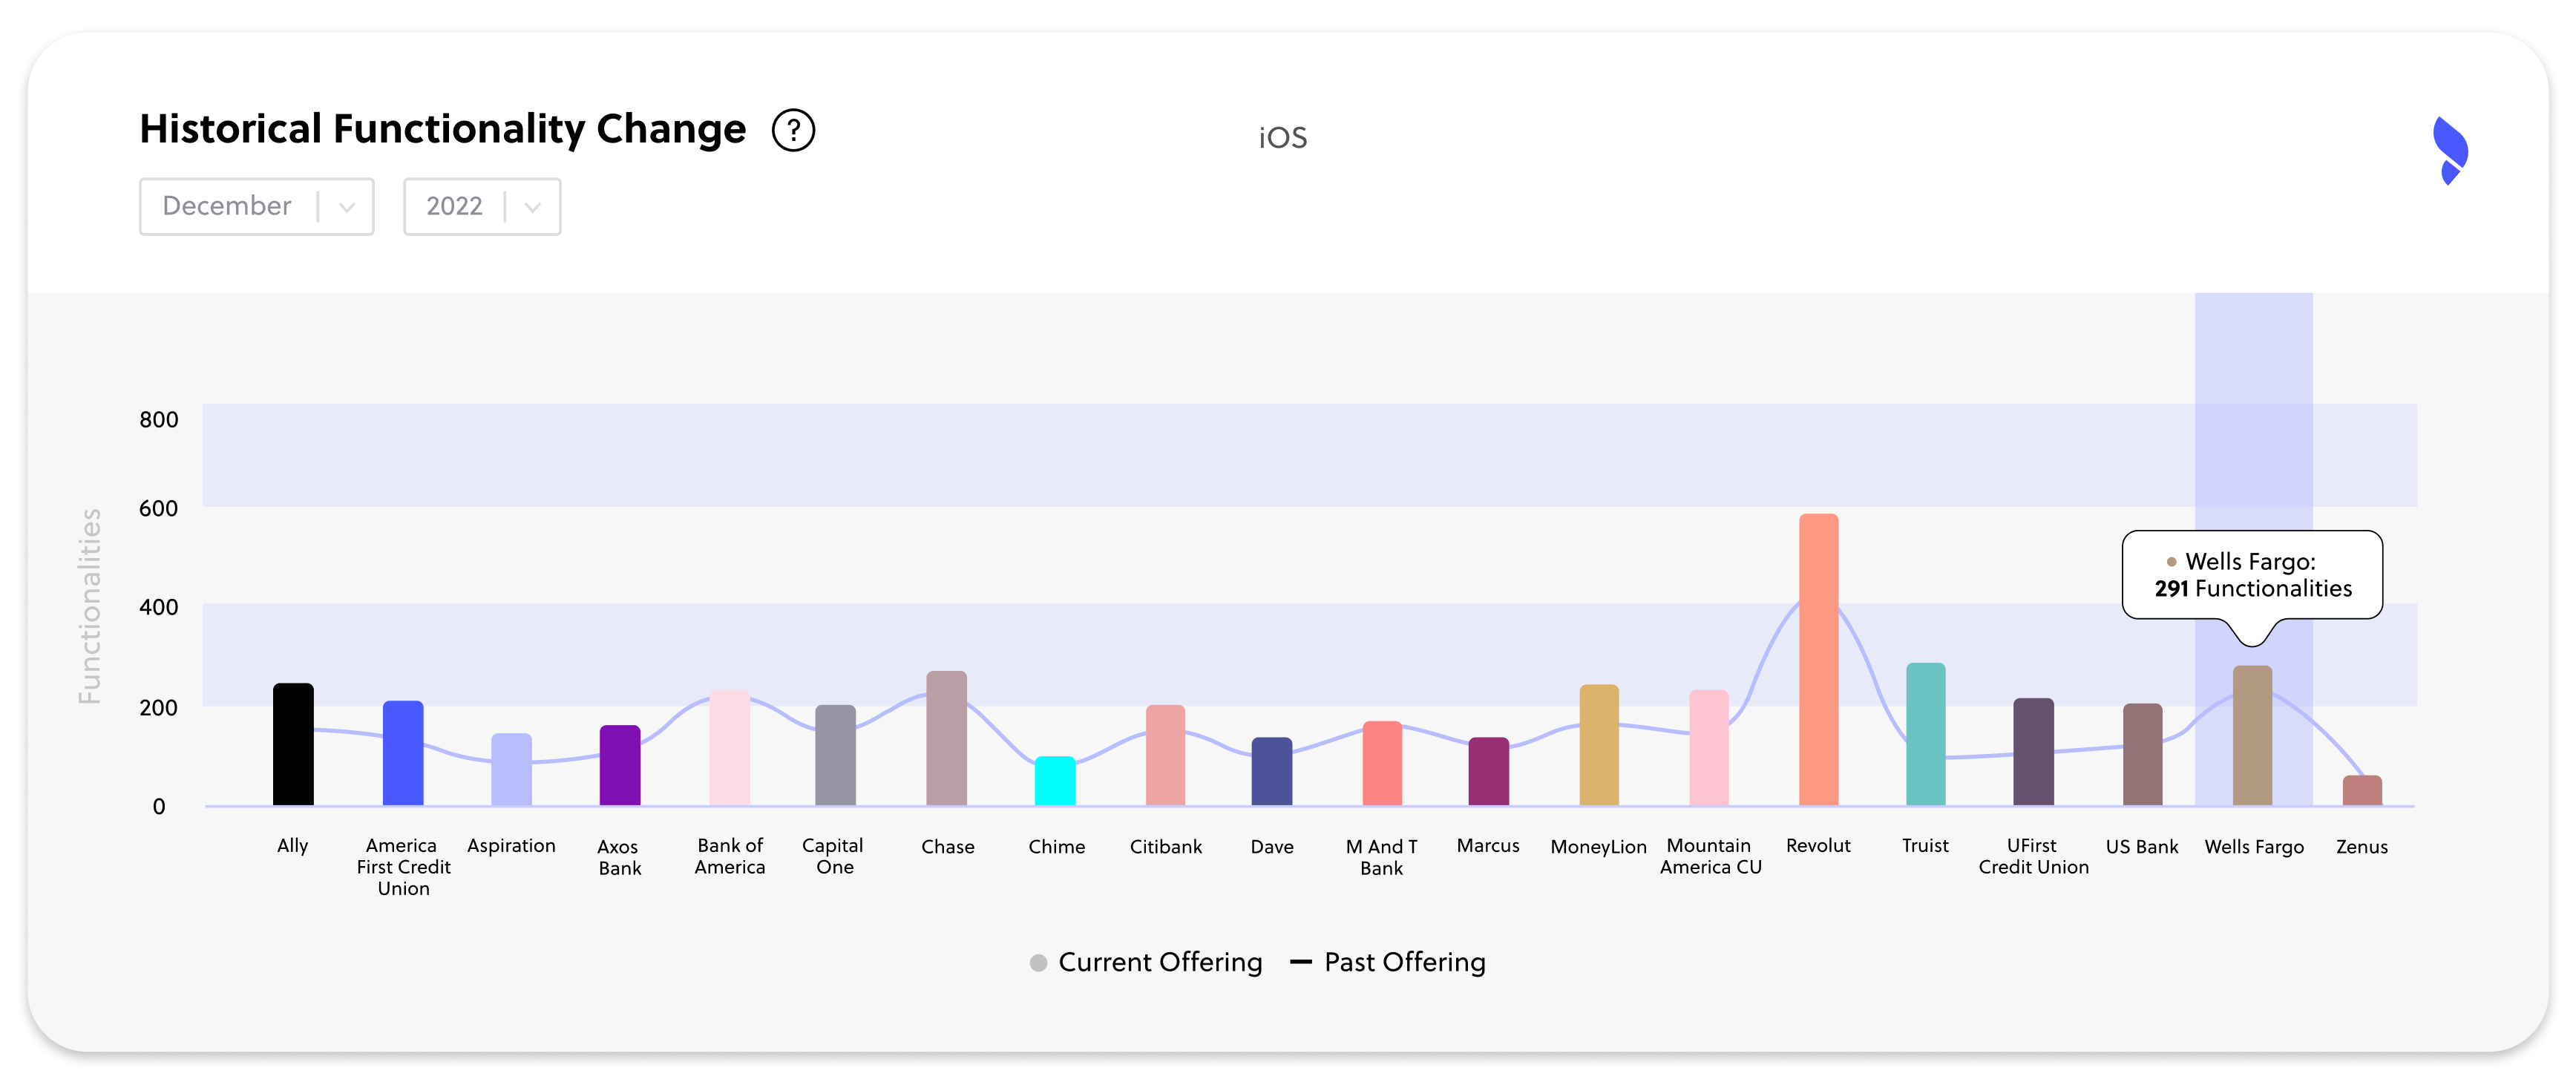
For instance, the data shows that Wells Fargo's functionalities have gone up from 253 to 291. In other words, in just over a year, they added 38 new functionalities.
Next, you can look at:
-
The specific categories where they added these new functionalities
-
For each category, what functionalities they added or removed
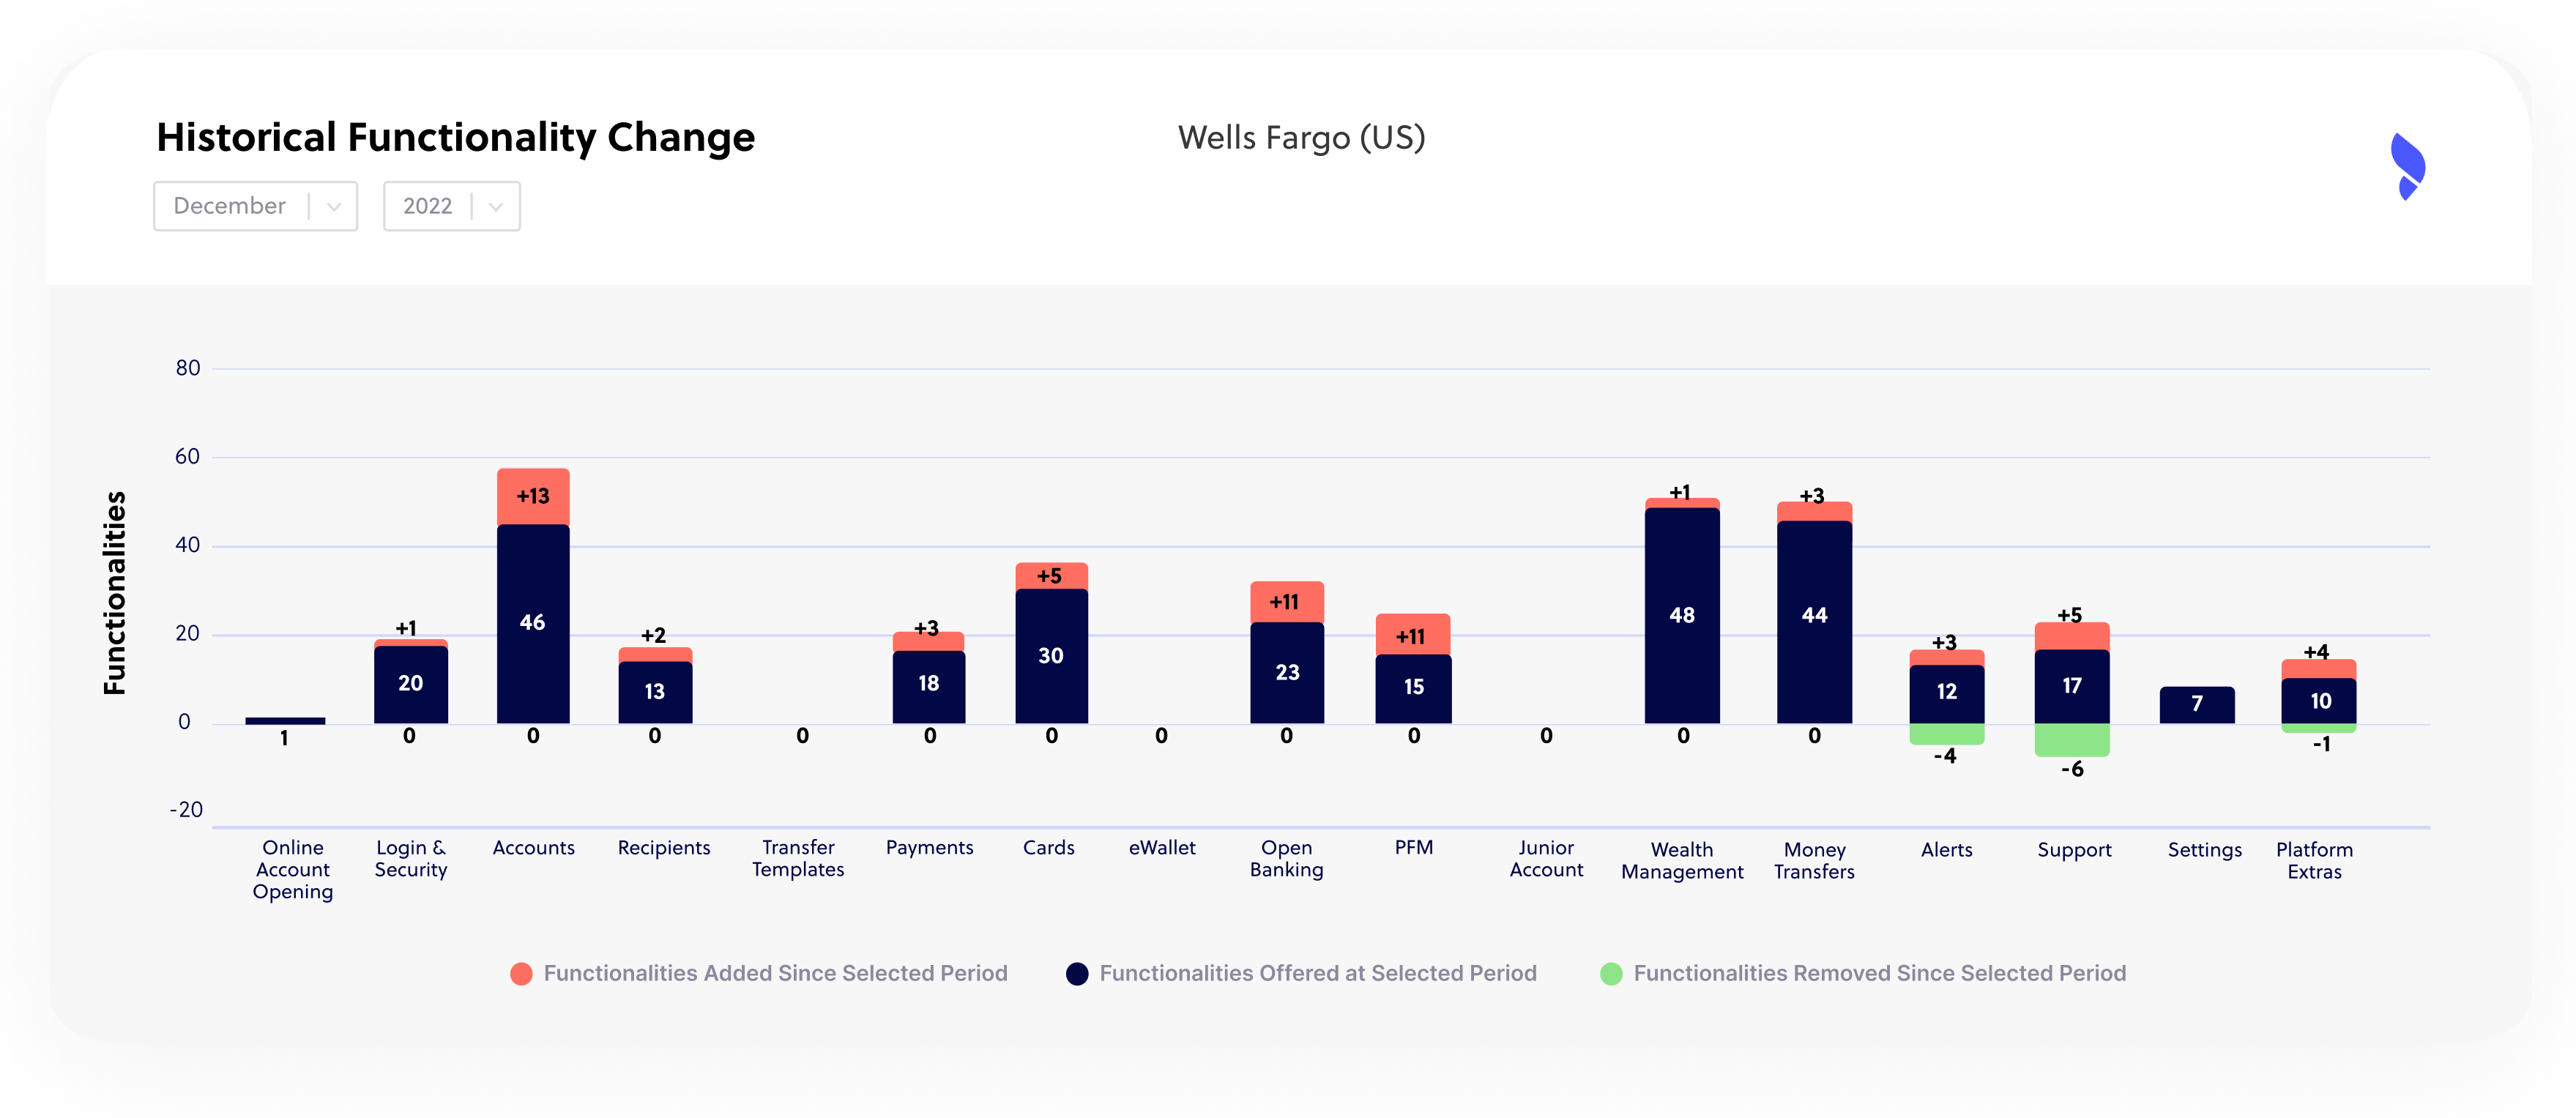
In Wells Fargo's case, the biggest change was in accounts, where they added 13 new functionalities. These were followed by open banking and personal finance management, with 11 new functionalities in each category.
The latter two categories are both growth areas in the US market. During 2023, the FDX API, the prevailing North American open banking standard, shared 42 million consumer records. Similarly, demand for personal finance management capabilities is on the rise, with the market growing at a compound annual rate of 12.2%.
By contrast, the number of functionalities in alerts and support came down. But a closer analysis shows this wasn't a downgrade, but a rethink — the functionalities were replaced by others.
Clicking on a specific category — open banking, for instance — takes you to a detail screen where you can see which specific functionalities Wells Fargo added and a description of what each one does.
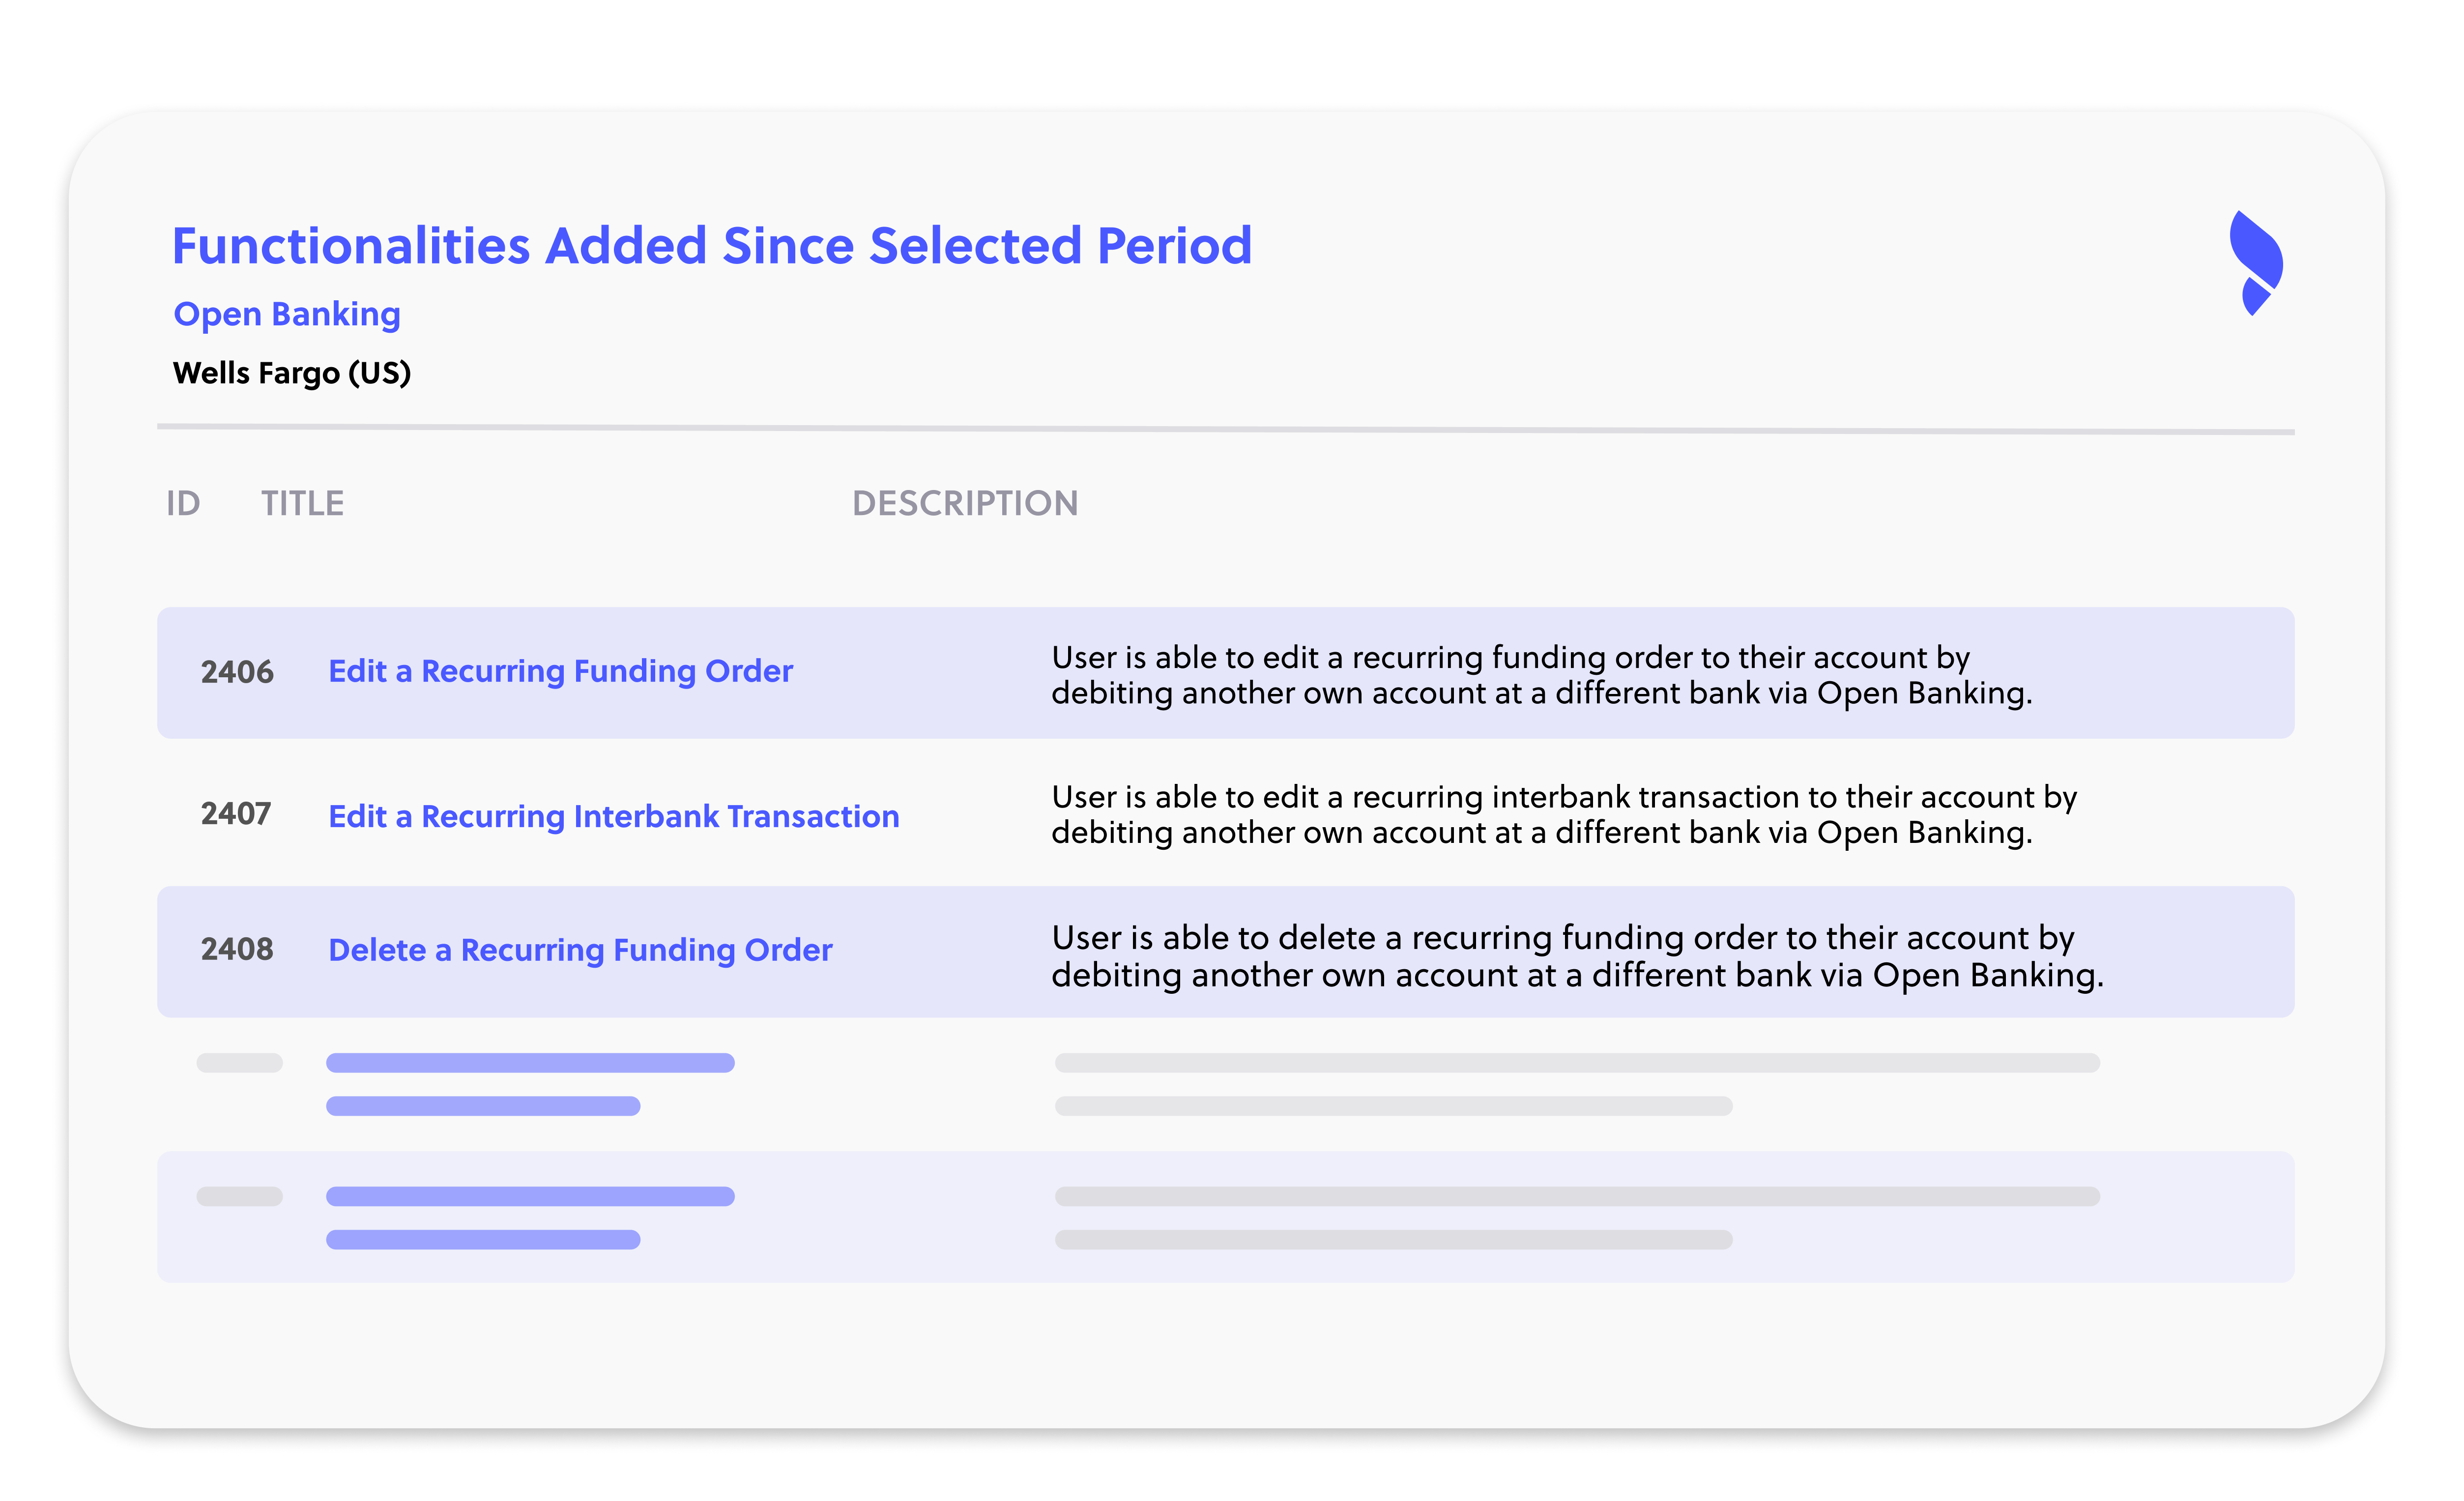
You can then click on each functionality to watch a step-by-step video walkthrough of how Wells Fargo implemented it.
FinTech Insights: now with more data points than ever before
When you're investing huge amounts of time, effort, and resources into making your product the best it can be, there's no such thing as too much data.
Knowledge is power. It can highlight untapped opportunities. It can help you avoid pitfalls that could set you back months. Most significant of all, it can spark new ideas that could give you the edge over your competitors.
In tech, seemingly insignificant changes can lead to revolutionary breakthroughs. FinTech Insights puts the data you need to come up with these changes at your fingertips, so you can get on with the business of making banking better for your customers and leading your market.
Looking for a quick, effective way to carry out in-depth digital banking research?
Try FinTech Insights, free, today
Build a digital banking strategy that can't be challenged
Let's show you how FinTech Insights can help you wow your customers, on every login.